Technical Study
Gold X2 Announces Filing of NI 43-101 Technical Report for the Moss Gold Project Preliminary Economic Assessment
AUXX · Price
Executive Summary
- Gold X2 Mining announced the filing of an NI 43‑101 technical report presenting a Preliminary Economic Assessment for its 100% owned Moss Gold Project in Ontario.
- The PEA indicates the deposit could support a long‑life mining operation with strong production and low operating costs.
- Updated NI 43‑101 mineral resource estimates show 2.458 M oz Indicated gold (1.04 g/t) and 4.209 M oz Inferred gold (0.97 g/t), plus significant indicated and inferred silver resources.
Key Details
- Report Title & Date: “Preliminary Economic Assessment – NI 43‑101 Technical Report, Moss Gold Project, Ontario, Canada,” dated March 12 2026; effective January 26 2026.
- Prepared By: G Mining Services (GMS); reviewed and approved by independent Qualified Person Nicolas Vanier‑Larrivée, ing., GMS.
- Scope of Report: Includes property description, accessibility, mineral processing & metallurgical testing, resource estimation, mining methods, recovery methods, infrastructure, operating costs, CAPEX, economic analysis, and project execution plan.
- Mineral Resource Estimate (MRE):
- Gold – Indicated: 2.458 million oz at 1.04 g/t Au contained in 73.8 Mt.
- Gold – Inferred: 4.209 million oz at 0.97 g/t Au contained in 134.7 Mt.
- Silver – Indicated: 3.160 million oz at 1.53 g/t Ag contained in 64.3 Mt.
- Silver – Inferred: 6.273 million oz at 1.55 g/t Ag contained in 125.9 Mt.
- PEA Highlights: Suggests potential for a long‑life mine with a strong production profile and low unit production costs (specific cost figures not disclosed in the release).
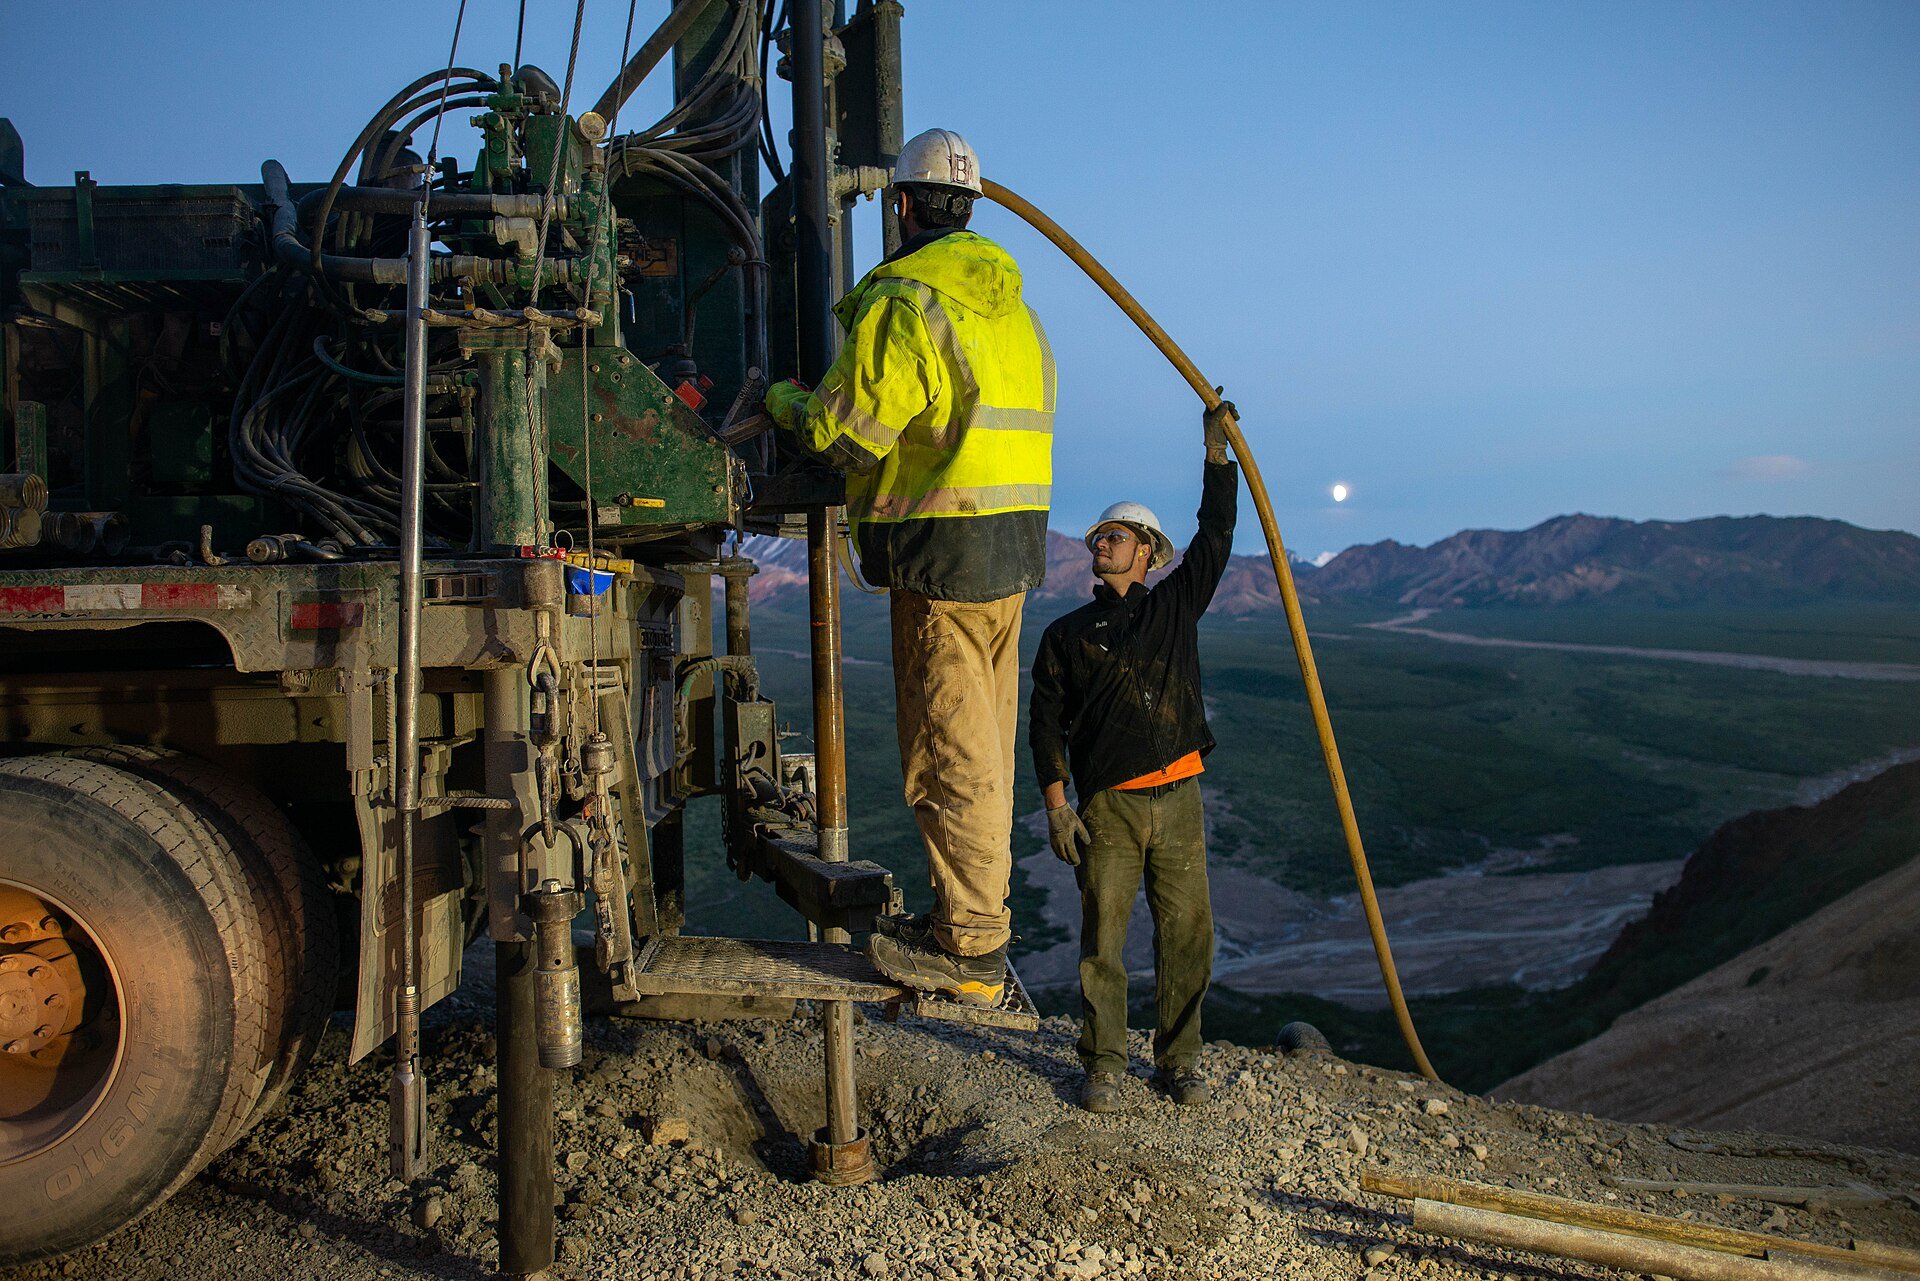
- Capital Invested to Date: Over $100 million of new capital; ~100,000 m of drilling completed on Moss Gold Project (total >300,000 m drilled).
- Access & Infrastructure: Direct access from Trans‑Canada Highway, nearby hydroelectric power, supportive local communities, and skilled workforce.
- Availability: Full technical report accessible via the company website (www.goldx2.com) and SEDAR+ issuer profile.
Notable Quotes
- “Results of a preliminary economic assessment (“PEA”) of the Moss Gold Project suggest the potential for the deposit to support a long‑life mining operation with a strong production profile and low production costs.” – Michael Henrichsen, President & CEO, Gold X2 Mining Inc.
More from Gold X2 Mining Inc.
Nov 02, 2026 · 07:00